
Click here to access this dispatch as a formatted PDF.
Passive funds tracking emerging market (EM) indices have long promised geographic and sectoral diversification. In practice, however, EM indices have become increasingly concentrated bets on a handful of high-flying Taiwanese and Korean tech stocks.
EM indices no longer provide diversification
EM indices are now concentrated Taiwan/Korea bets
Approximately $1.6 trillion is invested in ETFs and mutual funds tracking the MSCI Emerging Markets Index, MSCI Emerging Markets Investable Market Index, and other emerging markets (EM) indices compiled by New York-based MSCI Inc. (NYSE: MSCI). These include the world’s largest EM fund, the iShares Core MSCI Emerging Markets ETF (IEMG), as well as its smaller cousin the iShares MSCI Emerging Markets ETF (EEM), which promise investors broad diversification in the form of exposure to more than a thousand companies spanning 24 countries. As of 2026, however, the MSCI Emerging Markets Index is increasingly a concentrated bet on just two markets: Taiwan and South Korea, which in recent months have accounted for half or more of the entire index.
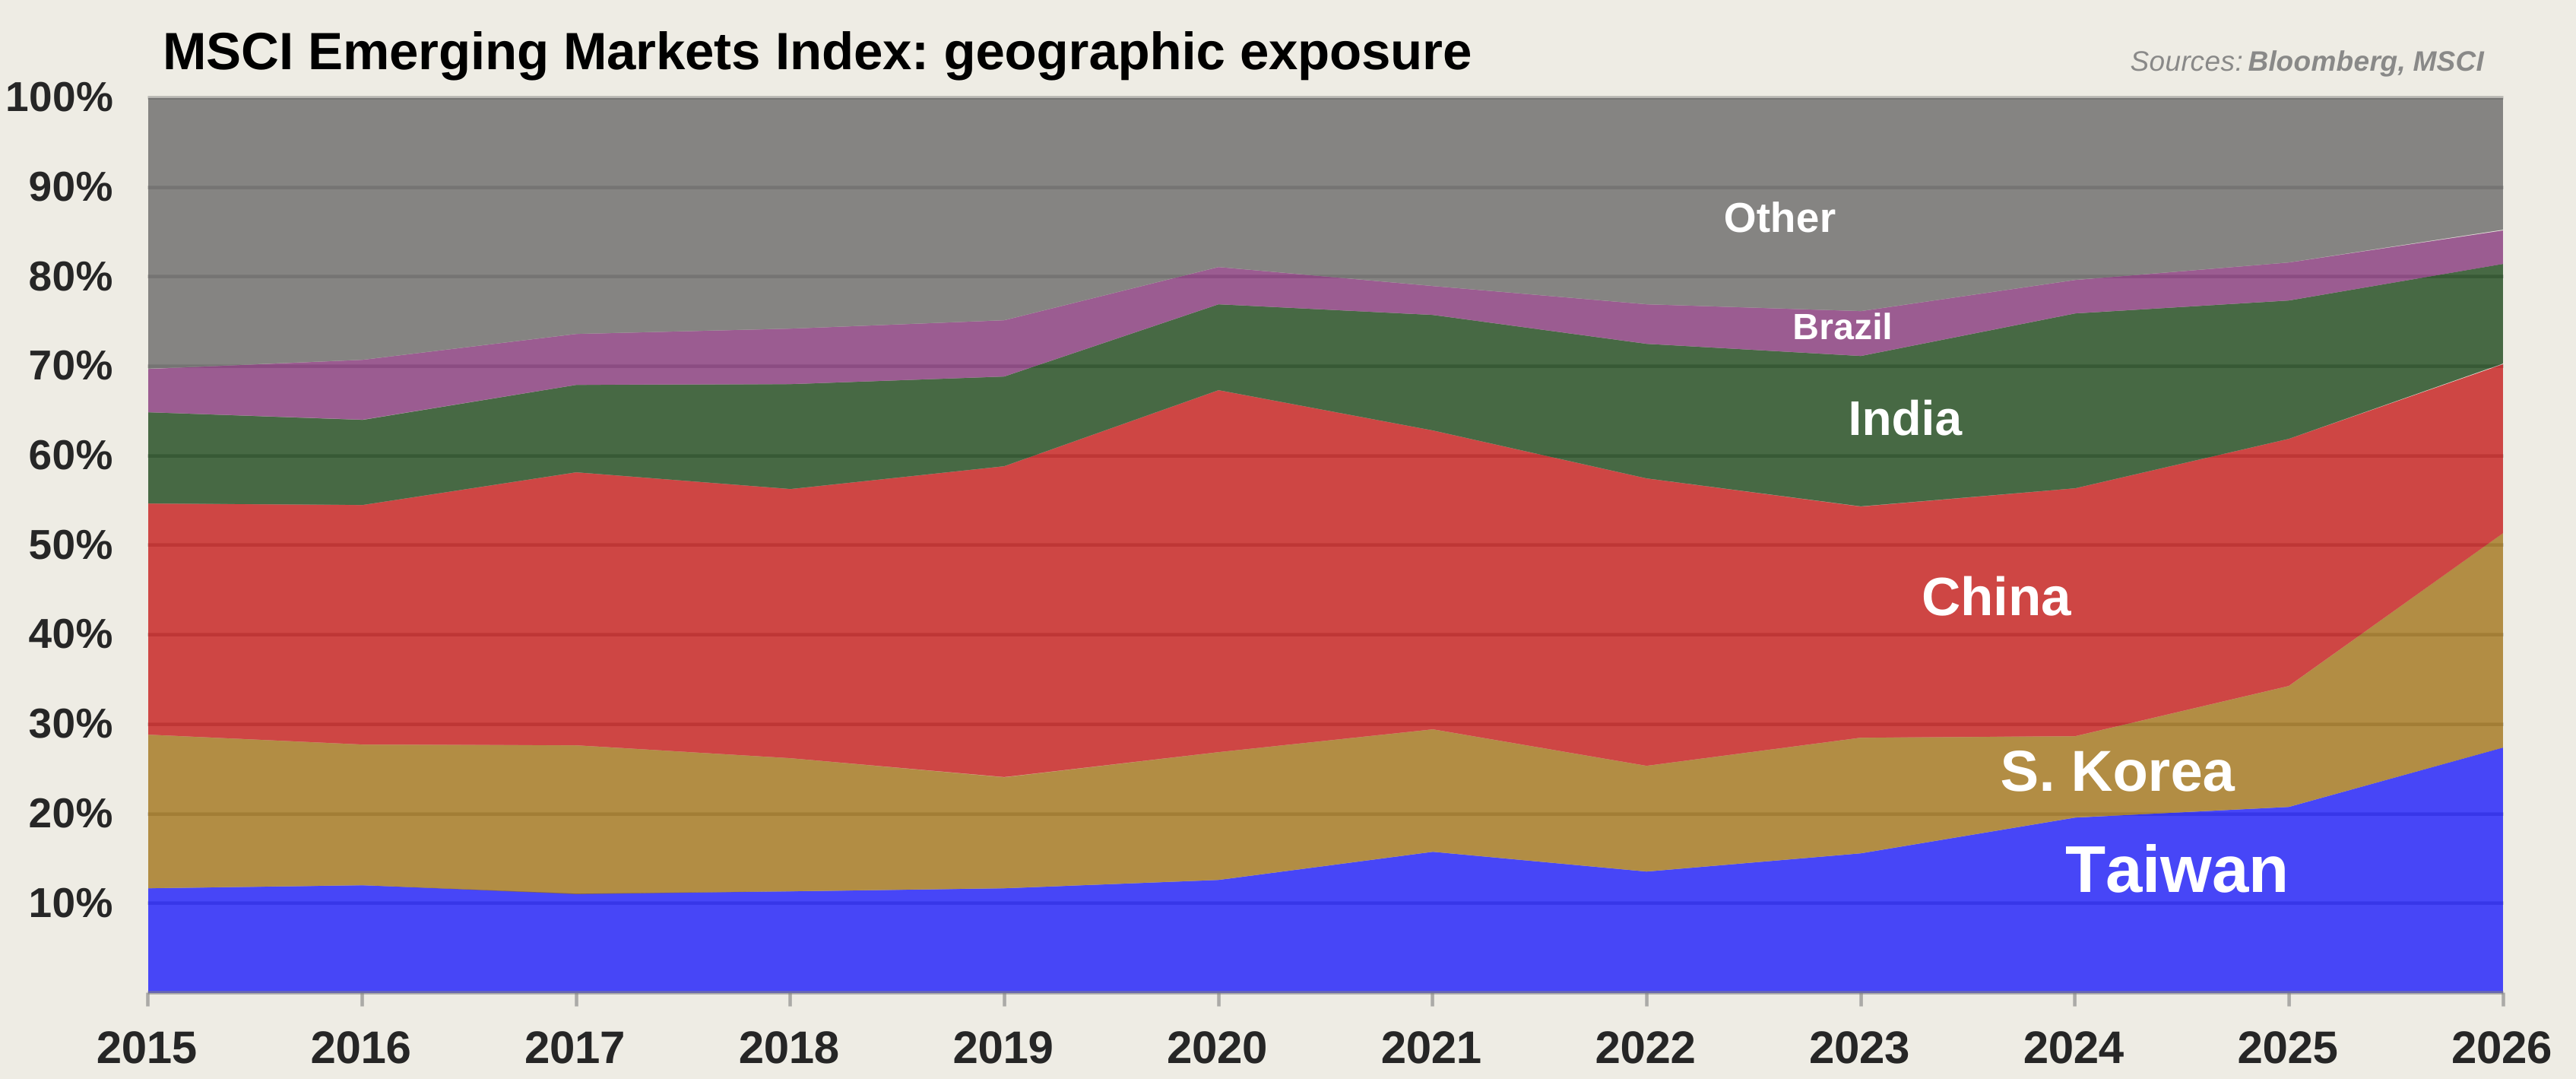
The causes of this increasing geographic concentration have been the AI-driven rallies in Taiwanese and Korean semiconductor stocks. As discussed in our recent blog post India bears: missing the AI forest for the trees, both countries’ equity booms have been driven by a handful of firms’ swelling exports of semiconductors to a highly concentrated set of mainly American and Chinese customers.

.jpg)
The FTSE Emerging Markets All Cap China A Inclusion Index (for brevity’s sake, hereafter referred to as “the FTSE EM index”) and other FTSE EM indices are tracked by funds holding another ~$0.2 trillion in assets, most notably the Vanguard FTSE Emerging Markets ETF (VWO). The FTSE EM index is marginally less geographically distorted thanks to FTSE having classified South Korea as a developed market since 2009. Even so, over the past decade the VWO ETF’s exposure to Taiwan more than doubled (from ~15% to ~34% today), while its allocation to markets other than Taiwan and mainland China shriveled from ~60% a decade ago to just ~41% as of this writing.
EM indices are now concentrated tech/AI bets
The MSCI Emerging Markets Index’s exposure to the technology sector has tripled over the past decade, from ~15% in 2016 to ~45% today. Nearly one-third of this index is now attributable to just three high-flying chip giants – Taiwan Semiconductor Manufacturing Co. (a.k.a. TSMC – NYSE: TSM), Samsung Electronics (KRX: 005930), and SK Hynix (KRX: 000660) – a concentration analogous to the combined weight of America’s “Magnificent 7” tech titans in the S&P 500. Furthermore, the MSCI EM index’s next-biggest sector weighting after tech includes financial firms deeply intertwined with the global semiconductor boom such as Taiwan’s Fubon Financial Holdings (TPE: 2881), as well as lenders such as South Korea’s KB Financial Group (NYSE: KB) that are heavily exposed to retail investors’ leveraged positions in chipmakers.
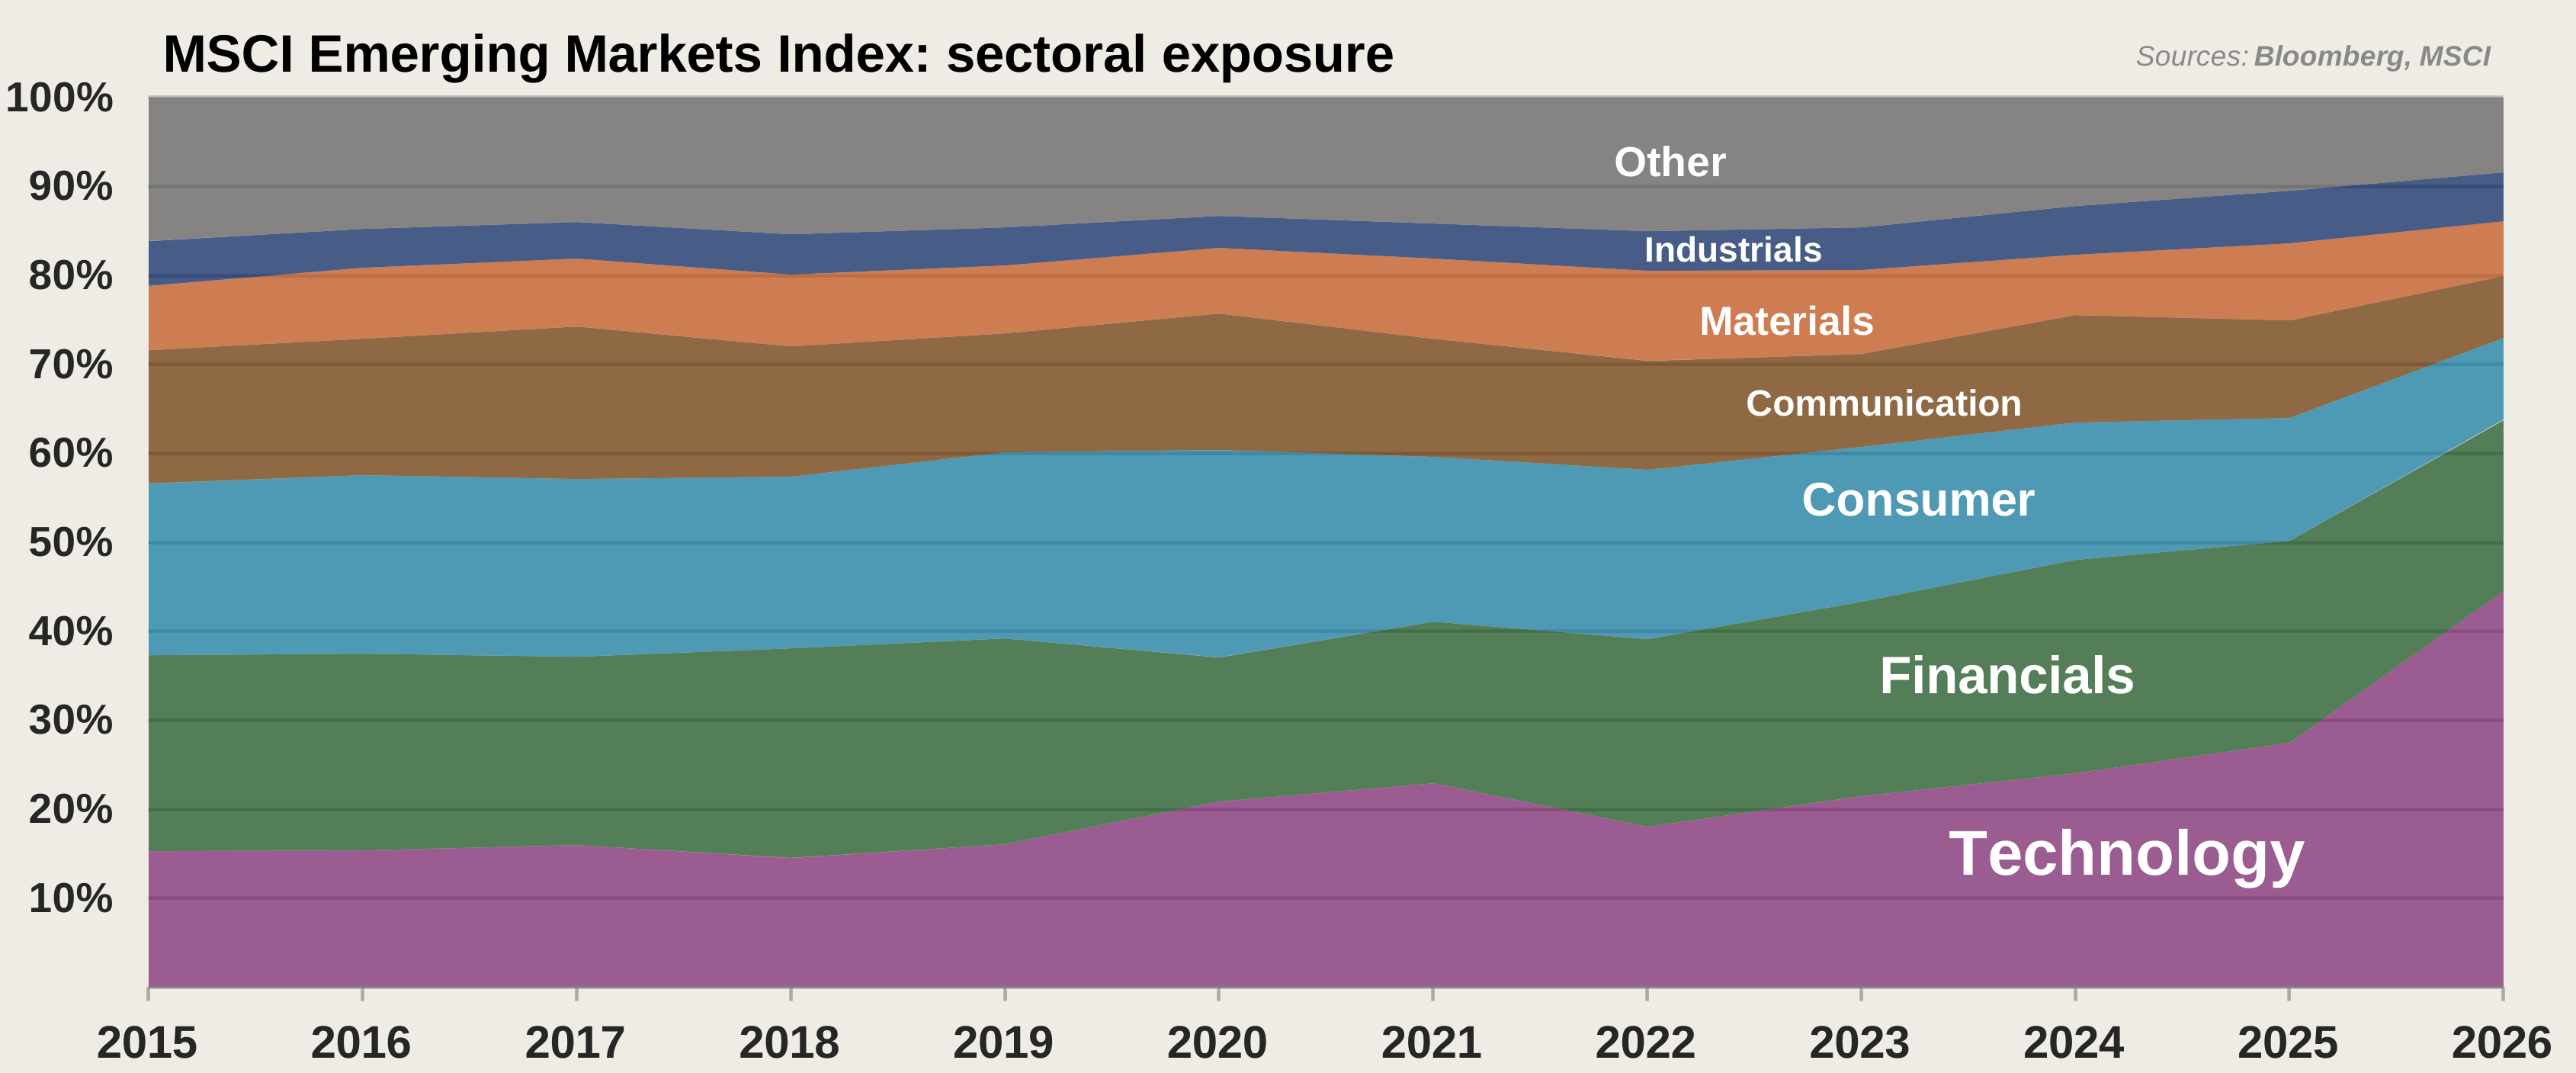
Due to this rapid increase in the MSCI Emerging Markets Index’s concentration, passive EM allocations tracking this and other EM indices no longer benefit from the diversification that ostensibly is among the key reasons investors seek exposure to international markets in the first place. Because the earnings of TSMC, Samsung, and SK Hynix are largely reliant on continued growth in their exports of AI-related goods to a small group of mainly American and Chinese customers, the MSCI Emerging Markets Index is now less a bet on the continued development of domestic Asian economies and more a bet against the prospect of a slowdown in global demand for semiconductors – an industry that has historically been highly cyclical, and whose current boom depends on aggressive growth in the capital expenditures of a handful of U.S. “hyperscaler” tech giants.
A pullback in the hyperscalers’ eye-watering CapEx plans could plausibly be triggered by any breakthrough allowing for more resource-efficient AI models, any disruptions to supplies of imported input materials essential to chip manufacturing, any intensification of competition from mainland Chinese chipmakers such as the recently-listed ChangXin Memory Technologies (a.k.a. CXMT – SSE: 688825), and/or any run-of-the-mill, credit crunch-induced developed-world recession.
Passive is no longer neutral
Passive EM indices embed a huge implicit bet on the AI boom
Passive strategies based on leading EM indices increasingly expose investors to a concentrated bet on a few mainly Taiwanese and Korean semiconductor companies dependent on continued growth in demand for AI hardware – demand that is ultimately largely driven by a handful of U.S. tech hyperscalers. As a result, such strategies not only fail to provide geographic or sectoral diversification, but also exhibit high and rising correlation with tech-heavy U.S. equity indices.
By contrast, India’s economy and equity market are highly diversified and driven primarily by domestic consumption. No single firm accounts for more than ~6% of the MSCI India index, and the share of GDP attributable to private consumption is close to 60% – nearly 20 percentage points higher than in Taiwan.
Give your local India active manager a call
Investors seeking to allocate capital to dynamic emerging market economies should reconsider the value of active strategies designed specifically to provide exposure to high-quality, well-managed earnings compounders benefiting directly from the ongoing development of EM markets’ domestic economies. In our view, within the EM universe the most exciting opportunities by far can be found in India – an economy whose world-leading growth is underpinned by durable, long-term forces including youthful demographics, accelerating urbanization, savings financialization, and prudent macroeconomic governance.
* * *
Andrei Stetsenko
September 14, 2026
Legal information and disclosures
The views expressed are the views of the author as of the date indicated on each posting; such views are subject to change without notice. Farley Capital L.P. (Farley Capital)has no duty or obligation to update the information contained herein. Further, Farley Capital makes no representation, and it should not be assumed, that past investment performance is an indication of future results. Any discussion regarding investment returns or financial projections are provided as illustrative examples only and no inference shall be made therefrom regarding the potential for returns on any investment discussed. Moreover, you should be aware that all types of investments involve a significant degree of risk, and wherever there is potential for profit, there is also the possibility of loss.
This content is being made available for informational and educational purposes only and should not be used for any other purpose. The information contained herein does not constitute and should not be construed as financial, legal, or tax advice, or as an offering of advisory services. The information contained herein shall not constitute an offer to sell, or a solicitation to subscribe for, interests in any investment vehicle managed by Farley Capital, which offer or solicitation will only be made to qualified investors and accompanied by a private placement memorandum, subscription agreement, and other related offering documents. Certain information contained herein concerning economic trends and performance is based on or derived from information provided by independent third-party sources. Farley Capital believes that the sources from which such information has been obtained are reliable; however, it cannot guarantee the accuracy or completeness of such information and has not independently verified the accuracy or completeness of such information or the assumptions on which such information is based.
This content, including the information contained herein, may not be copied, reproduced, republished, or posted in whole or in part, in any form without the prior written consent of Farley Capital.

Past performance of Gymkhana Partners and any funds managed by Farley Capital L.P. (collectively, the “Funds”) is not indicative of future results. No representations or warranties of any kind are made or intended, and none should be inferred, with respect to the economic return or the tax consequences from a potential investment in the Funds. Each investor should consult their own counsel and accountant for advice concerning the various legal, tax and economic matters concerning their investment. The information provided herein does not constitute an offer to sell an interest in the Funds. Such offer can only be made to qualified investors pursuant to the Funds’ Confidential Private Placement Memorandum (“Offering Memorandum”), the Subscription Documents relating thereto and the Limited Liability Company Agreement, as applicable, which set forth the complete terms of the offer.
No representation or warranty (express or implied) is made or can be given with respect to the accuracy or completeness of the information found within this website. Certain information constitutes “forward-looking statements” about potential future results. Those results may not be achieved, due to implementation lag, other timing factors, portfolio management decision-making, economic or market conditions or other unanticipated factors. Nothing contained herein shall be relied upon as a promise or representation whether as to past or future performance or otherwise.
Past performance of Gymkhana Partners and any funds managed by Farley Capital L.P. (collectively, the “Funds”) is not indicative of future results. No representations or warranties of any kind are made or intended, and none should be inferred, with respect to the economic return or the tax consequences from a potential investment in the Funds. Each investor should consult their own counsel and accountant for advice concerning the various legal, tax and economic matters concerning their investment. The information provided herein does not constitute an offer to sell an interest in the Funds. Such offer can only be made to qualified investors pursuant to the Funds’ Confidential Private Placement Memorandum (“Offering Memorandum”), the Subscription Documents relating thereto and the Limited Liability Company Agreement, as applicable, which set forth the complete terms of the offer.
No representation or warranty (express or implied) is made or can be given with respect to the accuracy or completeness of the information found within this website. Certain information constitutes “forward-looking statements” about potential future results. Those results may not be achieved, due to implementation lag, other timing factors, portfolio management decision-making, economic or market conditions or other unanticipated factors. Nothing contained herein shall be relied upon as a promise or representation whether as to past or future performance or otherwise.