
Click here to access this dispatch as a formatted PDF.
India’s society is young, growing, and urbanizing – setting the demographic foundation for decades of turbo-charged economic development. The number of Indians aged 12 or younger exceeds the United States’ entire population.1 Over the next two decades, India is expected to add more people to its labor force each week than the U.S. adds in a year,2 while its urban areas are forecast to gain a New York City’s worth of new residents every ten months.3

Today, the average Indian is a 27-year-old villager eking out a modest living from agricultural-related rural labor.5 By 2050, the average Indian will be a 37-year-old city-dweller, with a manufacturing or services job generating over three times more economic output than farm work.6 The members of her generation will enter the prime of their working lives with relatively few dependents to support, allowing India to re-invest an increasing share of its income into infrastructure and education.
Expansion in the working-age share of a country’s population (a phenomenon known as a “demographic dividend” – see page 4) and rapid urbanization (see page 6) are each historically-proven drivers of elevated growth in per capita GDP – even when occurring in isolation. Through our analysis of decades of demographic and economic data (see page 11), however, we demonstrate that countries experiencing a demographic dividend and rapid urbanization simultaneously grow per capita income at a rate much faster than economies benefiting from only one or the other.
India – uniquely among the world’s major economies – boasts the powerful combination of both phenomena, underpinning projections for a sustained period of elevated per capita GDP growth.
India: the world’s youngest major economy
India has the youngest population among the world’s twenty largest economies. Two-thirds of its 1.3 billion people are 35 or under; the roughly half a billion Indians who are under 20 years old account for one-fifth of the entire world’s young people.7
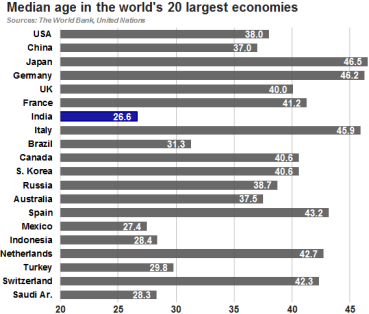
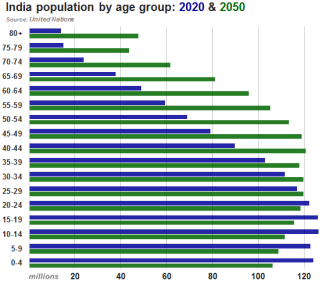
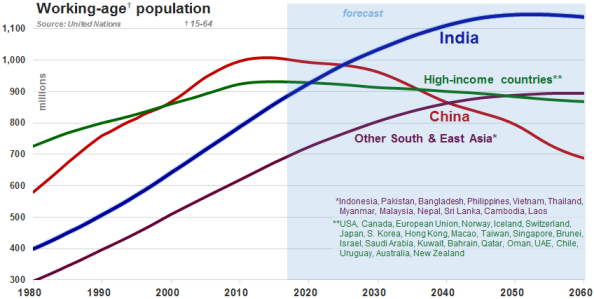
Since the birth of today’s median-age (27-year-old) Indian, the country’s birthrate8 has dropped by two-fifths.9 This has given rise to a “youth bulge” – a generation larger than those immediately before and after it – that is steadily working its way through the age structure. As this “boom” generation gradually enters the labor force between 2015 and 2050, India’s workingage population (defined as people aged 15 to 64) is projected to expand by 33% – in stark contrast to the grim demographic trends facing China and most of the world’s developed economies, which will struggle to support ballooning numbers of senior citizen dependents even as their labor forces shrink.10
India’s demographic dividend
Due to the combination of India’s youth bulge, continued steady declines in the country’s birthrate,11 and the limited number of Indians approaching retirement, the expansion in India’s workforce is set to outpace its overall population growth through the 2040s. Within the next two decades, India will have the highest ratio of working-age people to dependents among the world’s twenty largest economies.12
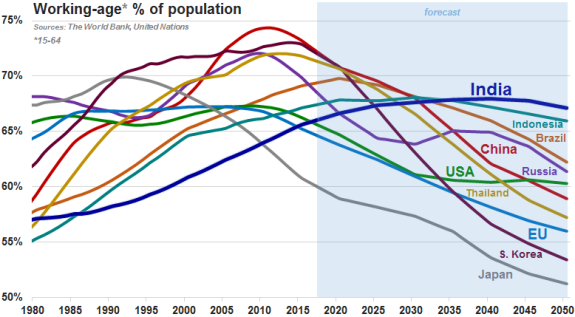
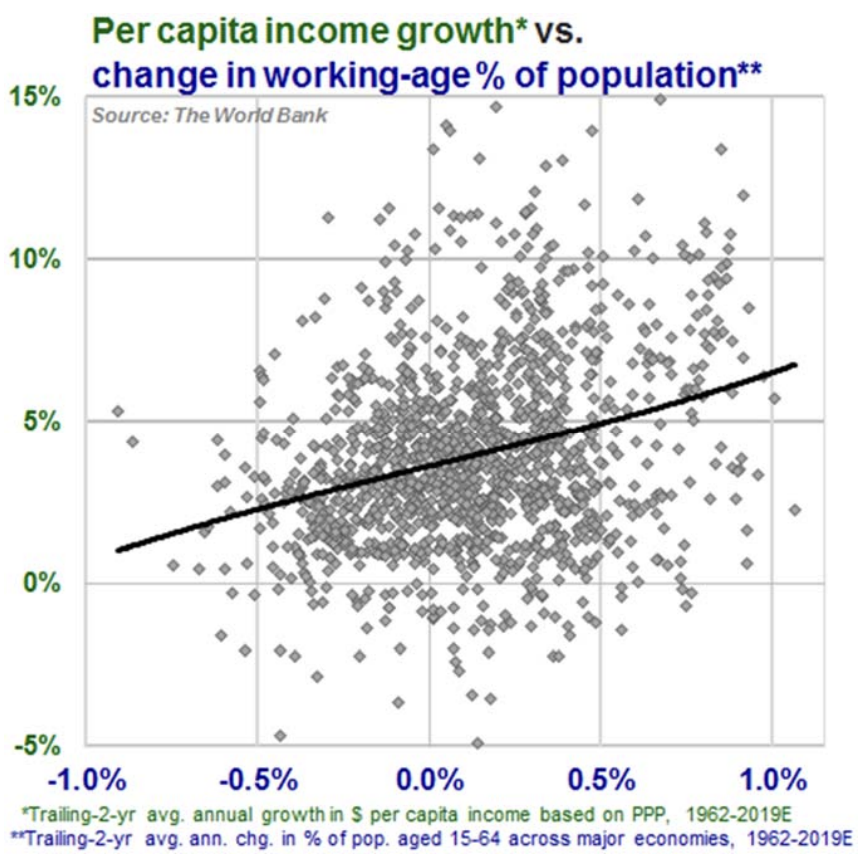
The forecast steady expansion in the working-age share of India’s population – a phenomenon known as a “demographic dividend” – can be expected to provide a significant and sustained boost to the country’s economic growth. Across decades of economic history, there has been a strong positive correlation between increases in the working-age proportion of a population and faster economic development.13 Demographic dividends were key factors behind the exceptionally high growth rates achieved across Europe and much of East Asia in the decades following World War II, as baby boom generations entered those regions’ labor markets.14
A demographic dividend lifts average incomes in two ways. As a growing share of the population begins contributing to GDP and the number of dependents per worker falls, GDP per head goes up. However, this first-order, “arithmetic” effect explains only approximately one-quarter of the overall uplift in per capita income growth achieved across historical examples of economies experiencing a demographic dividend.1
Most of the economic benefits of a demographic dividend arise from an assortment of second- and third-order “behavioral” effects. Because workers (unlike children and retirees) accumulate savings, an expanding ratio of working-age people is associated with a rising domestic savings rate – increasing the resources available for investment and allowing a country like India (which already invests in excess of its domestic savings) to fund that added investment without relying on foreign capital.16
With relatively fewer dependents to support, more capital can be directed toward productivity-enhancing investments (as opposed to, say, old-age pensions).17 As families become smaller, they are able to provide each of their offspring with higher-quality food, healthcare, and education. Falling infant mortality and better schooling (particularly for girls) improve children’s life prospects and reinforce the lower-birthrate trend at the root of the demographic dividend.
These demographic forces have already had a positive impact on India. Since the turn of the millennium, the year-over-year declines in India’s infant mortality and birthrate have accelerated.18 Over the same period, the proportion of Indian high school-age children who are enrolled in school has doubled, to nearly two thirds.19

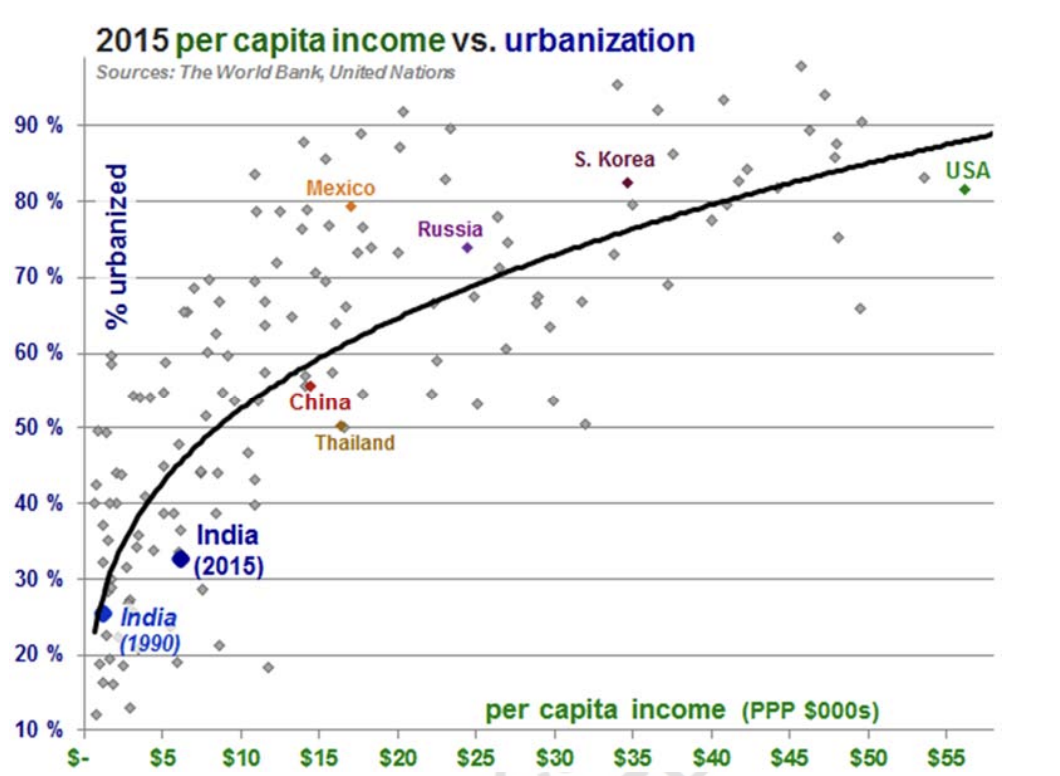
Today, two-thirds of Indians still live in rural areas – making the country roughly as urbanized as China in 1995, South Korea in 1965, Japan in 1935,21 Europe in 1905,22 or America in 1885.23
However, India’s rural-to-urban migration is gathering pace, setting it on the rapid urbanization trajectory followed by every country in history that has achieved an extended period of robust growth or reached “developed” (a.k.a. “industrialized”) economy status. It took India nearly sixty years (between 1958 and 2015) to grow its urban population by 340 million (to a current total of approximately 420 million). It will add the next 340 million in half the time – laying the groundwork for decades of elevated economic growth.24
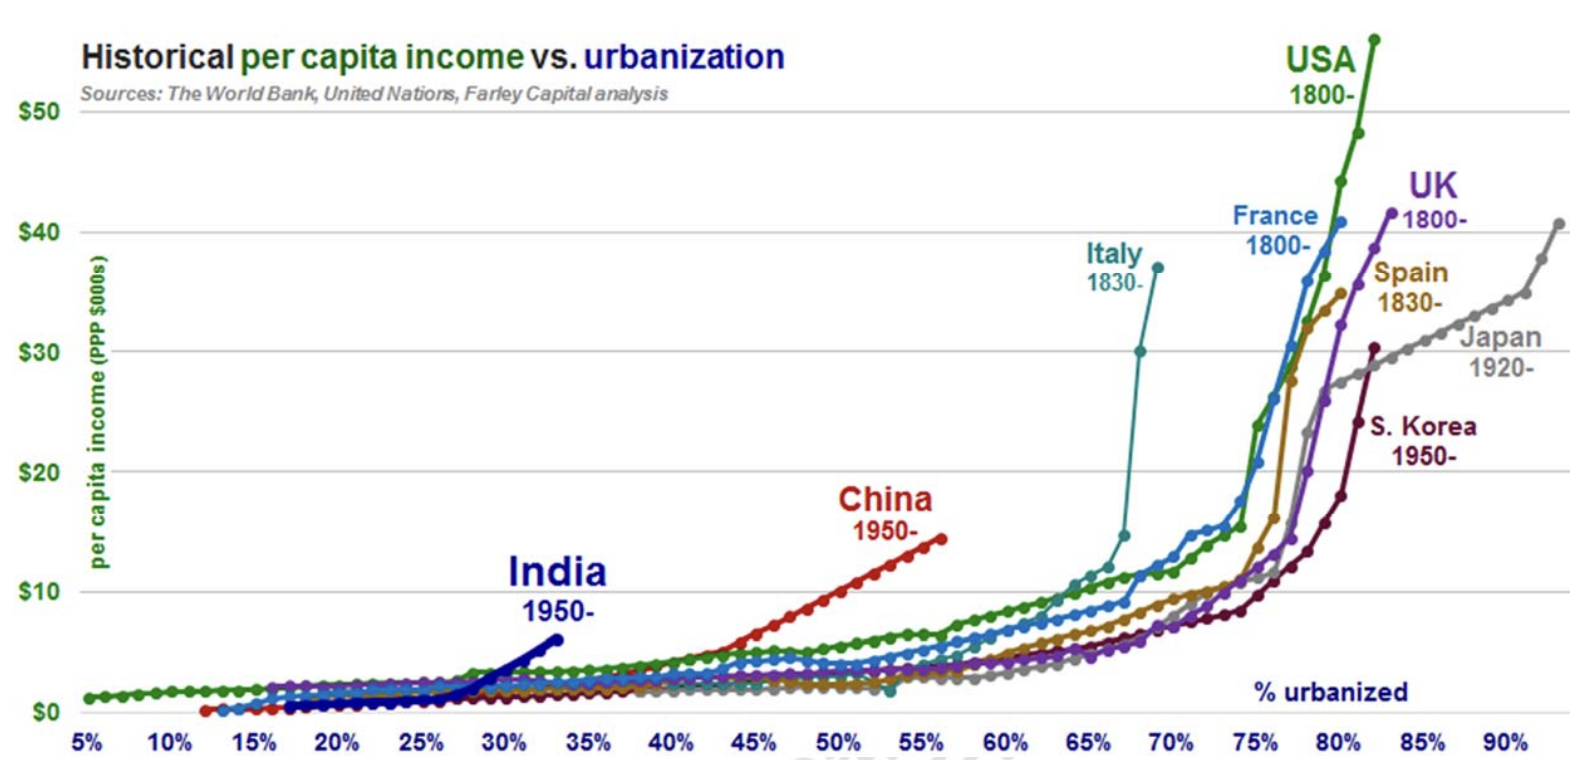
Urbanization is typically the biggest single factor driving gains in a developing country’s per capita income. The process by which urbanization accelerates income growth is well-understood. In every case to date – starting with Britain and the Netherlands in the 18th century – it has been led by a shift of agricultural laborers to urban jobs in manufacturing or services.25 The average productivity of a worker in the latter two sectors is typically more than three times that of a farm laborer.
As cities grow larger and the urban share of a population increases, a second effect – faster growth in urban productivity – becomes increasingly potent.6 Productivity is higher in cities than in rural areas, and in bigger metropolises relative to smaller cities, due to “economies of agglomeration” that arise from clusters of increasingly specialized firms, suppliers, customers, and skilled employees.26 Prominent Indian clusters include Chennai (automotive manufacturing), Vadodara (chemicals), and Bangalore (IT services).
India’s urbanization yields second-order effects that further reinforce its economic benefits. Urbanization speeds the progression towards lower birthrates: Indian cities’ fertility rate stands at approximately 1.8 – far below rural areas’ 2.5 rate, and roughly in line with that of the developed world.27 As new city-dwellers find employment, develop smaller families, and recognize the value of education in competitive urban job markets, they gain both the resources and the incentive to invest in additional schooling for their children.28
Equipped with more advanced skills, subsequent generations gain access to even higher-productivity (and better-paying) opportunities – setting into motion a “virtuous cycle” of growing prosperity.29 As cities expand and become more productive, they reinforce the economic incentives driving rural-to-urban migration.30 Evidence for urbanization’s role as a catalyst for India’s economic advancement can already be seen in the disproportionate economic heft of the country’s existing urbanites: the one-third of India’s people who already live in cities contribute an estimated two-thirds of total GDP.31
India’s slums
The epic scale of India’s urbanization is not without its growing pains: most visibly, in the form of the country’s notorious slums – which accommodate millions of Indians, including over two-fifths of the total population in Mumbai and other large cities.32
To a Western observer, slums may seem like places of static, squalid misery: crowded, dismal shantytowns without adequate sanitation, police protection, or other basic services essential for a dignified life. Yet given such conditions, why would millions of Indians leave villages for life in slums?
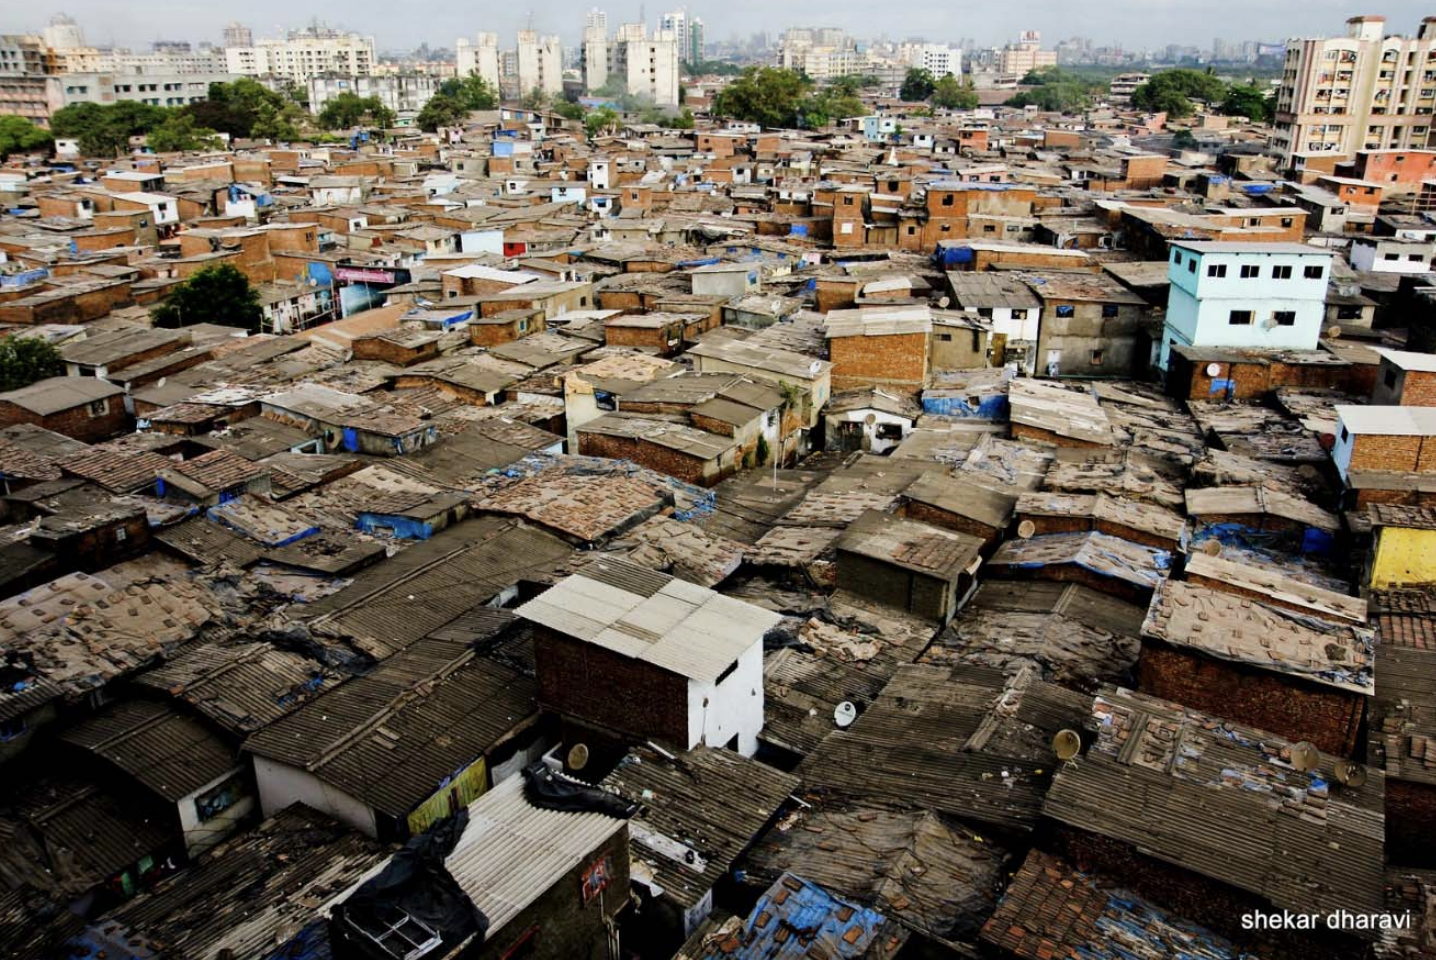
Although not obvious to a Westerner, India’s slums are largely the result of rational choices made by migrants in pursuit of higher-paying jobs and better opportunities. In China, authorities employ a system of internal passports to limit the flow of migrants into cities.34 By contrast, India’s democratic society affords its citizens free mobility, while also enabling interest groups to lobby for laws that impede the development of affordable housing. In Mumbai, a 1947 rent control act deters construction of rental apartments. As a consequence, slums – settlements built illegally on public land – represent the city’s “only free market in rental housing”.35 Meanwhile, vested interests preserve prime tracts of real estate for sub-optimal use. India’s Ministry of Defense, for example, operates 97 golf courses covering over 8,000 acres of mostly urban land.36
Slum-dwellers’ alternative is not an idyllic pastoral life, but rather erratic agricultural work in an un-electrified village with little in the way of educational provision37 but plenty of suffocating customs (e.g., co-habitation with one’s in-laws, child marriage, and caste-based discrimination) that severely constrain autonomy38 – especially that of young people.39
Last year, I asked a young Mumbai resident, Aditya, why he had traveled hundreds of miles from his village in Rajasthan – leaving behind his wife and children – to work as a driver in the metropolis, where such work earns an average monthly salary of around ₹13,000 ($200).40 The answer was because for him, it was an upgrade. Even after paying his rent for a small shared room, Aditya netted enough money driving in Mumbai to support his family back in Rajasthan – and far more than what he could have made working back in the countryside.
Although a Westerner may find it difficult to see them as such, slums are steppingstones in the process of urbanization and economic development. Slums give migrants access to education for their children, allowing them to rise into the urban middle-class – making room for the next wave of arrivals.41 UN data show that over the past two decades, tens of millions more Indians have relocated out of urban slums42 than moved into them.43
India’s extraordinarily competitive labor costs
The average compensation of a single German factory employee (roughly $46 per hour) is equivalent to the wages of approximately thirty Indian manufacturing workers.44
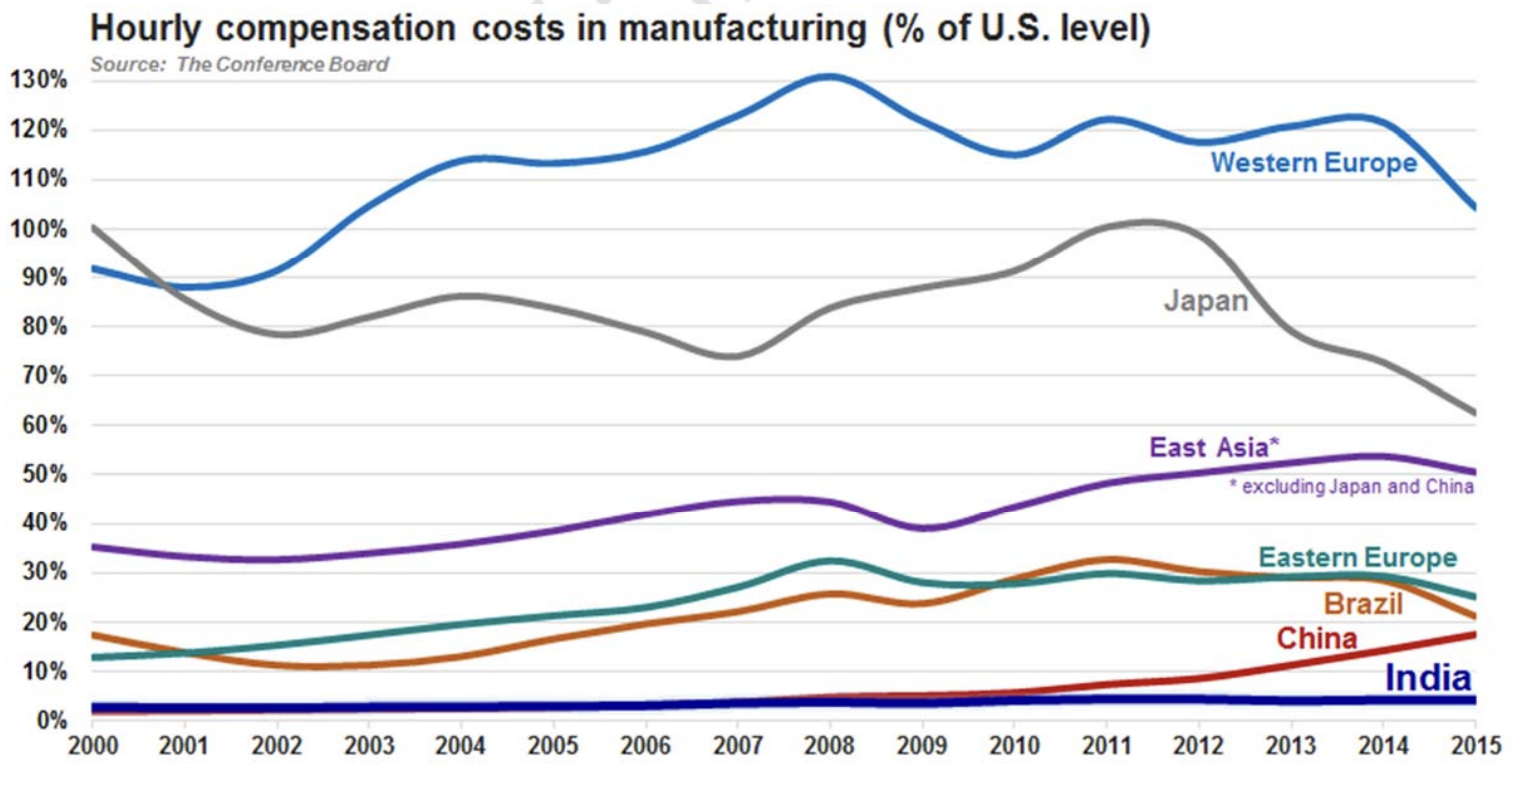
Given the hundreds of millions of villagers yet to migrate into its urban workforce, India should be able to sustain this competitive advantage – a key feature of its increasing appeal for job-creating manufacturers – for decades.
In China, average manufacturing wages have risen by double-digits each year since 2010. Not coincidentally, that was also when the country’s demographic dividend came to end, its demise hastened by China’s decades-long “one child” policy.45 By contrast, manufacturers can count on India’s ongoing demographic dividend and rural-to-urban migration to ensure a ready supply of low-cost labor for the foreseeable future.46 Alternatives such as Vietnam and Indonesia may also be attractive, but India is “the only country [with] the scale to take up where China is leaving off.”47
My visits to Indian companies usually involve interacting with an overstaffed security gate, a team of receptionists, an elevator operator, and multiple people offering tea and coffee. At hotel gyms, I’ve learned not to try to get a towel myself: there’s an attendant whose job it is to hand it to you. On a 2014 visit to the campus of a Gujarat steel pipe manufacturer, I observed dozens of people tending to the landscaping and touching up the walls. The CEO explained paternalistically that India’s “luxury” of “too much labor” allowed him to hire hundreds of “peons” – a word (often used in a derogatory way in the West) that I last came across in a book about medieval history.
India’s complementary demographic advantages
Demographic dividends and rural-to-urban migrations are each historically proven drivers of elevated growth in per capita income – even when occurring in isolation. India – uniquely among the world’s major economies – boasts the powerful combination of both phenomena.
To quantify each phenomenon’s economic impact, we conducted an analysis combining World Bank and United Nations data on twenty-five leading economies’ working-age populations, urbanization rates, and real (inflation-adjusted) U.S. dollar per capita income growth over the 1950-2016 period.48 For each of those 67 years, we assigned each country to one of four buckets:
(1) Economies that saw neither substantial growth in the working-age share of their population (i.e., a demographic dividend) nor a substantial increase in the share of their population living in urban areas (i.e., rapid urbanization);
(2) Economies experiencing a demographic dividend, but not rapid urbanization;
(3) Economies undergoing rapid urbanization, but not a demographic dividend; or
(4) Economies experiencing both phenomena simultaneously.
We then averaged together the data points falling into each of the four categories, and compared the results to the overall average of all the data points in our 67-year, twenty-five-country sample. Major economies experiencing either a demographic dividend or rapid urbanization (but not both) had noticeably faster income growth, compared to the overall average. Per capita income in economies undergoing both phenomena simultaneously, however, grew much faster – at an annual rate two full percentage points above the overall average.49
As recently as 2010, five countries met the criteria for inclusion in bucket (4): China, Thailand, Vietnam, Malaysia, and Turkey. Since then, all five have seen their demographic dividends taper off, relegating them to bucket (3). In 2010, India was still in bucket (2), with the pace of its urban-to-rural migration on the cusp of our threshold for “rapid” urbanization. Today, the combination of a demographic dividend and rapid urbanization is present in only one major economy: India.
Among economies with shrinking labor forces, those that are still experiencing rapid urbanization (such as China and Thailand) continue to boast relatively dynamic growth – despite the fact that such countries cannot count on the positive feedback loops between expanding working-age populations, rising savings, and the investment needed to create high-productivity urban jobs.50 To a somewhat lesser extent, the same is true of economies that completed a rapid urbanization long before the peak of their demographic dividends (e.g., Mexico and Saudi Arabia).51
Unsurprisingly, bucket (1) showed the lowest average annual growth in per capita income: 2.7%, a full percentage point below the overall average. The economies falling into this category – as of 2016, every high-income country in our sample (including the U.S., Japan, and Germany), plus Brazil, Russia, and Argentina – can only continue to improve their standards of living by increasing the productivity of their already-urbanized, greying workforces.
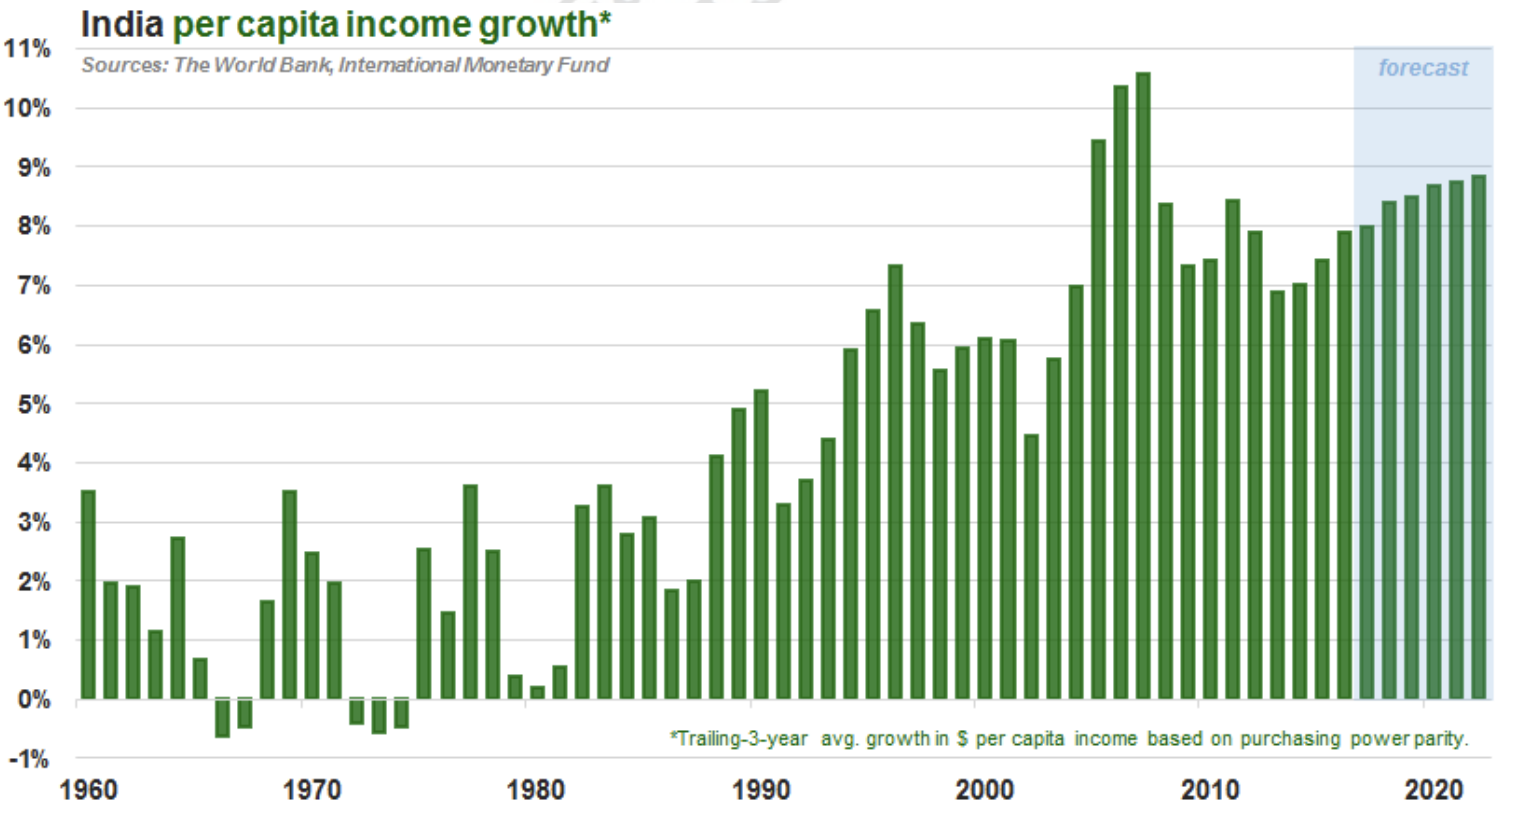
Over the past 25 years (since 1992), India’s per capita GDP has grown more than three times faster than it did in prior decades.52 Part of this improvement owes to the major economic reforms introduced following the country’s 1991 crisis (a topic for a future post). However, India’s demographic dividend and a significant acceleration in the pace of its urbanization deserve most of the credit.53
With a labor force projected to grow through the 2050s, a steadily rising ratio of working-age people to dependents, two-thirds of its people yet to move into higher productivity cities, and remarkably competitive labor costs, India boasts an exceptional combination of complementary demographic advantages. Their simultaneity – unique among the world’s major economies – forms an extraordinary dynamic, one that will serve as a powerful tailwind to India’s economic growth for decades to come.
* * *
Andrei Stetsenko
June 2, 2017
Legal Information and Disclosures
The views expressed are the views of the author as of the date indicated on each posting; such views are subject to change without notice. Farley Capital L.P. (Farley Capital) has no duty or obligation to update the information contained herein. Further, Farley Capital makes no representation, and it should not be assumed, that past investment performance is an indication of future results. Any discussion regarding investment returns or financial projections are provided as illustrative examples only and no inference shall be made therefrom regarding the potential for returns on any investment discussed. Moreover, you should be aware that all types of investments involve a significant degree of risk, and wherever there is potential for profit, there is also the possibility of loss.
This content is being made available for informational and educational purposes only and should not be used for any other purpose. The information contained herein does not constitute and should not be construed as financial, legal, or tax advice, or as an offering of advisory services. The information contained herein shall not constitute an offer to sell, or a solicitation to subscribe for, interests in any investment vehicle managed by Farley Capital, which offer or solicitation will only be made to qualified investors and accompanied by a private placement memorandum, subscription agreement, and other related offering documents. Certain information contained herein concerning economic trends and performance is based on or derived from information provided by independent third-party sources. Farley Capital believes that the sources from which such information has been obtained are reliable; however, it cannot guarantee the accuracy or completeness of such information and has not independently verified the accuracy or completeness of such information or the assumptions on which such information is based.
This content, including the information contained herein, may not be copied, reproduced, republished, or posted in whole or in part, in any form without the prior written consent of Farley Capital.
References
1 Government of India, Ministry of Home Affairs. Census of India, Population Enumeration Data (2011), Series C-13: Single Year Age Returns by Residence and Sex. Retrieved from http://www.censusindia.gov.in/2011census/C-series/C-13.html
2 United Nations, Department of Economic and Social Affairs, Population Division. World Population Prospects (2015), File POP/7-1: Total population (both sexes combined) by five-year age group, major area, region and country, 1950-2100, Medium fertility variant. Retrieved from https://esa.un.org/unpd/wpp
3 United Nations, Department of Economic and Social Affairs, Population Division. World Urbanization Prospects (2014), File 3: Urban Population at Mid-Year by Major Area, Region and Country, 1950-2050. Retrieved from https://esa.un.org/unpd/wup
4 Gagnon, Bernard. “Young students, Mumbai” (February 2006). Wikimedia Commons. Retrieved from https://commons.wikimedia.org/wiki/File:Young_students,_Mumbai.jpg
5 United Nations, Department of Economic and Social Affairs, Population Division. World Population Prospects (2015), File POP/5: Median age by major area, region and country. Retrieved from https://esa.un.org/unpd/wpp
6 Spence, Michael, Annez, Patricia, and Buckley, Robert. Urbanization and Growth (2009). The World Bank, Commission on Growth and Development. Retrieved from
https://openknowledge.worldbank.org/handle/10986/2582
7 United Nations, Department of Economic and Social Affairs, Population Division. World Population Prospects (2015), File POP/7-1: Total population (both sexes combined) by five-year age group, major area, region and country. Retrieved from https://esa.un.org/unpd/wpp
8 Refers to India’s “total fertility rate”, defined as the average number of children born to a woman over her lifetime – assuming the woman lives to the end of her childbearing years and bears children in accordance with age-specific average fertility rates of the specified year.
9 To approximately 2.4 children per woman, as of 2014. United Nations, Department of Economic and Social Affairs, Population Division. World Population Prospects (2015), File FERT/4: Total fertility by major area, region and country, 1950-2100. Retrieved via The World Bank, World Development Indicators, http://data.worldbank.org/indicator/SP.DYN.TFRT.IN
10 United Nations, Department of Economic and Social Affairs, Population Division. World Population Prospects (2015), File POP/15-1: Annual total population (both sexes combined) by five year age group, major area, region and country, 1950-2100, Medium fertility variant. Retrieved from https://esa.un.org/unpd/wpp
11 United Nations, Department of Economic and Social Affairs, Population Division. World Population Prospects (2015), File FERT/4: Total fertility by major area, region and country, 1950- 2100, Medium fertility variant. Retrieved from https://esa.un.org/unpd/wpp
12 United Nations, Department of Economic and Social Affairs, Population Division. World Population Prospects (2015), File POP/11-A: Total dependency ratio by major area, region and country, 1950-2100, Medium fertility variant. Retrieved from https://esa.un.org/unpd/wpp
13 The World Bank, World Development Indicators database (2016). Age dependency ratio: % of working-age population. Retrieved from http://data.worldbank.org/indicator/SP.POP.DPND
14 “A tale of three islands” (October 2011). The Economist. Retrieved from
http://www.economist.com/node/21533364
15 Eastwood, Robert and Lipton, Michael. “The Demographic Dividend: Retrospect and Prospect” (March 2012). Economic Affairs. Retrieved from
http://users.sussex.ac.uk/~ssfe3/ecaf_2124%20corrected.pdf
16 Züllig, Gabriel. “India’s Demographic Dividend: A Comparative Analysis of Population Structure Dynamics and the Impacts on the Current Account” (May 2013). University of St. Gallen, Swiss Institute for Economic Research. Retrieved from
http://www.makingsciencenews.com/catalogue/papers/499/download
17 Lee, Ronald. “The economic implications of changing age structures” (2007). University of California, Berkeley; based on research from the National Institutes of Health. Retrieved from http://un.org/en/development/desa/population/pdf/commission/2007/keynote/lee.pdf
18 The World Bank, World Development Indicators database (2017). Mortality rate, infant (per 1,000 live births). Retrieved from http://data.worldbank.org/indicator/SP.DYN.IMRT.IN
19 UNESCO Institute for Statistics. Education: Participation (December 2016), Gross enrolment ratio, upper secondary, both sexes (%). Retrieved from http://data.uis.unesco.org/
20 Stevens, Joshua. “Earth at Night” (April 2017). NASA Earth Observatory, using Suomi NPP VIIRS data from Miguel Román, NASA’s Goddard Space Flight Center. Retrieved from https://www.nasa.gov/feature/goddard/2017/new-night-lights-maps-open-up-possible-real-time applications
21 United Nations, Department of Economic and Social Affairs. “Growth of the world’s urban and rural population, 1920-2000” (August 1969), Table 45: Percentage of total population in agglomerations with 20,000 or more inhabitants, 1290-1960. Retrieved from
https://esa.un.org/unpd/wup/Archive/Files/studies/United%20Nations%20(1969)%20- %20Growth%20of%20the%20World's%20Urban%20and%20Rural%20Population,%201920- 2000.pdf
22 Caselli, Graziella, Vallin, Jacques, and Wunsch, Guillaume. Histoire du peuplement et prévisions (2004), Table 5: Évolution du taux d’urbanisation de 1700 à 1950 en Europe. Institut national d'études démographiques. Retrieved from https://books.google.com/books?id=xP
ZPPRMU8gC&pg=PA109
23 United States Census Bureau. Population and Housing Unit Counts: United States (1990). Population: 1790 to 1990. Retrieved from
https://www.census.gov/population/www/censusdata/files/table-4.pdf
24 Sankhe, Shirish et al. “India’s urban awakening: Building inclusive cities, sustaining economic growth” (April 2010). McKinsey Global Institute. Retrieved from http://www.mckinsey.com/global themes/urbanization/urban-awakening-in-india
25 McVey, Henry, McNellis, David, Lim, Frances, and Ramsey, Rebecca. “India: Unlocking the Demographic Dividend”. Insights: Global Macro Trends (November 2012); 2(10): 8-10. Retrieved from http://www.kkr.com/sites/default/files/KKR_Insights_121129.pdf
26 Iyer, Chidambaran. “Urbanization in India and Productivity of Manufacturing Industries: An Empirical Study”. Indian Economic Review (July-December 2013); 48(2): 297-322. Retrieved from http://www.jstor.org/stable/24583419
27 Nagarajan, Rema. “The myth of India’s population explosion” (June 2016). The Times of India. Retrieved from http://blogs.timesofindia.indiatimes.com/staying-alive/the-myth-of-indias-population explosion
28 Tumbe, Chinmay. “Urbanisation, demographic transition, and the growth of cities in India, 1870- 2020” (September 2016). International Growth Centre, C-35205-INC-1. Retrieved from https://www.theigc.org/wp-content/uploads/2016/11/Tumbe-2016-Working-paper.pdf
29 Bloom, David, Canning, David, and Sevilla, Jaypee. The Demographic Dividend: A New Perspective on the Economic Consequences of Population Change (2003). RAND, Population Matters. Retrieved from
https://www.rand.org/content/dam/rand/pubs/monograph_reports/2007/MR1274.pdf
30 Dyson, Tim. “The Role of the Demographic Transition in the Process of Urbanization” (September 2009). London School of Economics. Retrieved from
http://sgfm.elcorteingles.es/SGFM/FRA/recursos/doc/Actos/2009/Ponencias_ingles/Long_term_Impli cations/405329082_2192009135719.pdf
31 Tewari, Meenu et al. “Reimagining India’s Urban Future” (August 2015). The University of North Carolina at Chapel Hill, Indian Council for Research on International Economic Relations. Retrieved from https://planning.unc.edu/news/Working_Paper_306.pdf
32 Zhang, Yue. “Building a Slum-Free Mumbai” (March 2016). Woodrow Wilson International Cente for Scholars, Urban Sustainability Laboratory. Retrieved from
https://www.wilsoncenter.org/article/building-slum-free-mumbai
33 Manalam, Chandrashekar (Shekar). “Dharavi Slums” (2000). Manalam Photography. Retrieved from http://dighist.fas.harvard.edu/courses/2015/HUM54/exhibits/show/view_from_below/item/1561
34 “Ending apartheid” (April 2014). The Economist Special Report, China: The rural-urban divide. Retrieved from http://www.economist.com/news/special-report/21600798-chinas-reforms-work-its citizens-have-be-made-more-equal-ending-apartheid
35 Tabarrok, Alex. “A Twisted Tale of Rent Control in the Maximum City” (April 2017). Marginal Revolution. Retrieved from http://marginalrevolution.com/marginalrevolution/2017/ 04/ twisted-tale rent-control-maximum-city.html
36 Peterson, George and Thawakar, Vasudha. “Capturing the Value of Public Land for Urban Infrastructure” (October 2013). The World Bank, Sustainable Development Network, Finance Economics and Urban Department. Retrieved from
http://documents.worldbank.org/curated/en/652971468293129522/pdf/WPS6665.pdf
37 Anand, Geeta. “Fighting Truancy Among India’s Teachers, With a Pistol and a Stick” (February 2016). The New York Times. Retrieved from https://www.nytimes.com/2016/02/20/world/asia/india primary-school-system-uttar-pradesh.html
38 Barry, Ellen. “Young Rural Women in India Chase Big-City Dreams” (September 2016). The New York Times. Retrieved from https://www.nytimes.com/2016/09/25/world/asia/bangalore-india women-factories.html
39 Yardley, Jim. “In One Slum, Misery, Work, Politics and Hope” (December 2011). The New York Times. Retrieved from http://www.nytimes.com/2011/12/29/world/asia/in-indian-slum-misery-work
politics-and-hope.html
40 Pokharel, Krishna and Bellman, Eric. “How Much Do Indians Pay Their Many Domestic Helpers?” (May 2016). The Wall Street Journal. Retrieved from https://blogs.wsj.com/indiarealtime/2016/05/ 03/how-much-do-indians-pay-their-many-domestic-helpers/
41 Sanyal, Sanjeev. “India: Preparing for the Great Migration” (November 2014). LSE Cities: An International Centre Supported by Deutsche Bank. Retrieved from
https://lsecities.net/media/objects/articles/india-preparing-for-the-great-migration/en-gb/
42 United Nations Human Settlements Programme, State of the World’s Cities 2010/2011. “Cities for All: Bridging the Urban Divide” (March 2010). Retrieved from https://unhabitat.org/?mbt_book=state of-the-worlds-cities-20102011-cities-for-all-bridging-the-urban-divide
43 United Nations Human Settlements Programme, World Cities Report 2016. “Urbanization and Development: Emerging Futures” (February 2017). Retrieved from http://wcr.unhabitat.org/wp content/uploads/2017/02/WCR-2016-Full-Report.pdf
44 Refers to trailing two-year average of most recently available (2014-2015) hourly compensation data. The Conference Board, International Labor Comparisons Program. International Comparisons of Hourly Compensation Costs in Manufacturing (2015), Summary Tables. Retrieved from https://www.conference-board.org/ilcprogram/index.cfm?id=38269
45 Mitchell, Tom. “India may be more populous than China, research suggests (May 2017). Financial Times. Retrieved from https://www.ft.com/content/bb91ae64-3fc2-11e7-82b6- 896b95f30f58
46 The Conference Board, International Labor Comparisons Program. Hourly Compensation Costs (2015). Retrieved from https://www.conference-board.org/ilcprogram
47 Einhorn, Bruce. “India vs. China: The Battle for Global Manufacturing” (November 2014). Bloomberg News. Retrieved from https://www.bloomberg.com/news/articles/2014-11-06/india-vs dot-china-the-battle-for-global-manufacturing
48 International Monetary Fund, World Economic Outlook Database (April 2017). Gross domestic product based on purchasing-power-parity (PPP) per capita GDP. Retrieved from
https://www.imf.org/external/pubs/ft/weo/2017/01/weodata/index.aspx
49 United Nations, Department of Economic and Social Affairs, Population Division. World Urbanization Prospects (2014), File 2: Percentage of Population at Mid-Year Residing in Urban Areas by Major Area, Region and Country, 1950-2050. Retrieved from https://esa.un.org/unpd/wup
50 Jedwab, Remi, Christiaensen, Luc, and Gindelsky, Marina. “Demography, Urbanization and Development: Rural Push, Urban Pull and… Urban Push?” (September 2014). American Economic Association. Retrieved from https://www.aeaweb.org/conference/2015/retrieve.php?pdfid=809
51 Martine, George, Alves, Jose Eustaquio, and Cavenaghi, Suzana. “Urbanization and fertility decline: Cashing in on structural change” (December 2013). International Institute for Environment and Development, Human Settlements Group. Retrieved from
http://pubs.iied.org/pdfs/10653IIED.pdf
52 The World Bank, International Comparison program database (2017). GDP per capita based on purchasing power parity. Retrieved from http://data.worldbank.org/indicator/NY.GDP.PCAP.PP.CD
53 Aiyar, Shekhar, and Mody, Ashoka. “The Demographic Dividend: Evidence from the Indian States” (February 2011). International Monetary Fund, WP/11/38. Retrieved from
https://www.imf.org/external/pubs/ft/wp/2011/wp1138.pdf
Legal information and disclosures
The views expressed are the views of the author as of the date indicated on each posting; such views are subject to change without notice. Farley Capital L.P. (Farley Capital)has no duty or obligation to update the information contained herein. Further, Farley Capital makes no representation, and it should not be assumed, that past investment performance is an indication of future results. Any discussion regarding investment returns or financial projections are provided as illustrative examples only and no inference shall be made therefrom regarding the potential for returns on any investment discussed. Moreover, you should be aware that all types of investments involve a significant degree of risk, and wherever there is potential for profit, there is also the possibility of loss.
This content is being made available for informational and educational purposes only and should not be used for any other purpose. The information contained herein does not constitute and should not be construed as financial, legal, or tax advice, or as an offering of advisory services. The information contained herein shall not constitute an offer to sell, or a solicitation to subscribe for, interests in any investment vehicle managed by Farley Capital, which offer or solicitation will only be made to qualified investors and accompanied by a private placement memorandum, subscription agreement, and other related offering documents. Certain information contained herein concerning economic trends and performance is based on or derived from information provided by independent third-party sources. Farley Capital believes that the sources from which such information has been obtained are reliable; however, it cannot guarantee the accuracy or completeness of such information and has not independently verified the accuracy or completeness of such information or the assumptions on which such information is based.
This content, including the information contained herein, may not be copied, reproduced, republished, or posted in whole or in part, in any form without the prior written consent of Farley Capital.

Past performance of Gymkhana Partners and any funds managed by Farley Capital L.P. (collectively, the “Funds”) is not indicative of future results. No representations or warranties of any kind are made or intended, and none should be inferred, with respect to the economic return or the tax consequences from a potential investment in the Funds. Each investor should consult their own counsel and accountant for advice concerning the various legal, tax and economic matters concerning their investment. The information provided herein does not constitute an offer to sell an interest in the Funds. Such offer can only be made to qualified investors pursuant to the Funds’ Confidential Private Placement Memorandum (“Offering Memorandum”), the Subscription Documents relating thereto and the Limited Liability Company Agreement, as applicable, which set forth the complete terms of the offer.
No representation or warranty (express or implied) is made or can be given with respect to the accuracy or completeness of the information found within this website. Certain information constitutes “forward-looking statements” about potential future results. Those results may not be achieved, due to implementation lag, other timing factors, portfolio management decision-making, economic or market conditions or other unanticipated factors. Nothing contained herein shall be relied upon as a promise or representation whether as to past or future performance or otherwise.